34. Observation Model Probability
We will complete our Bayes' filter by implementing the observation model. The observation model uses pseudo range estimates and observation measurements as inputs. Let's recap what is meant by a pseudo range estimate and an observation measurement.
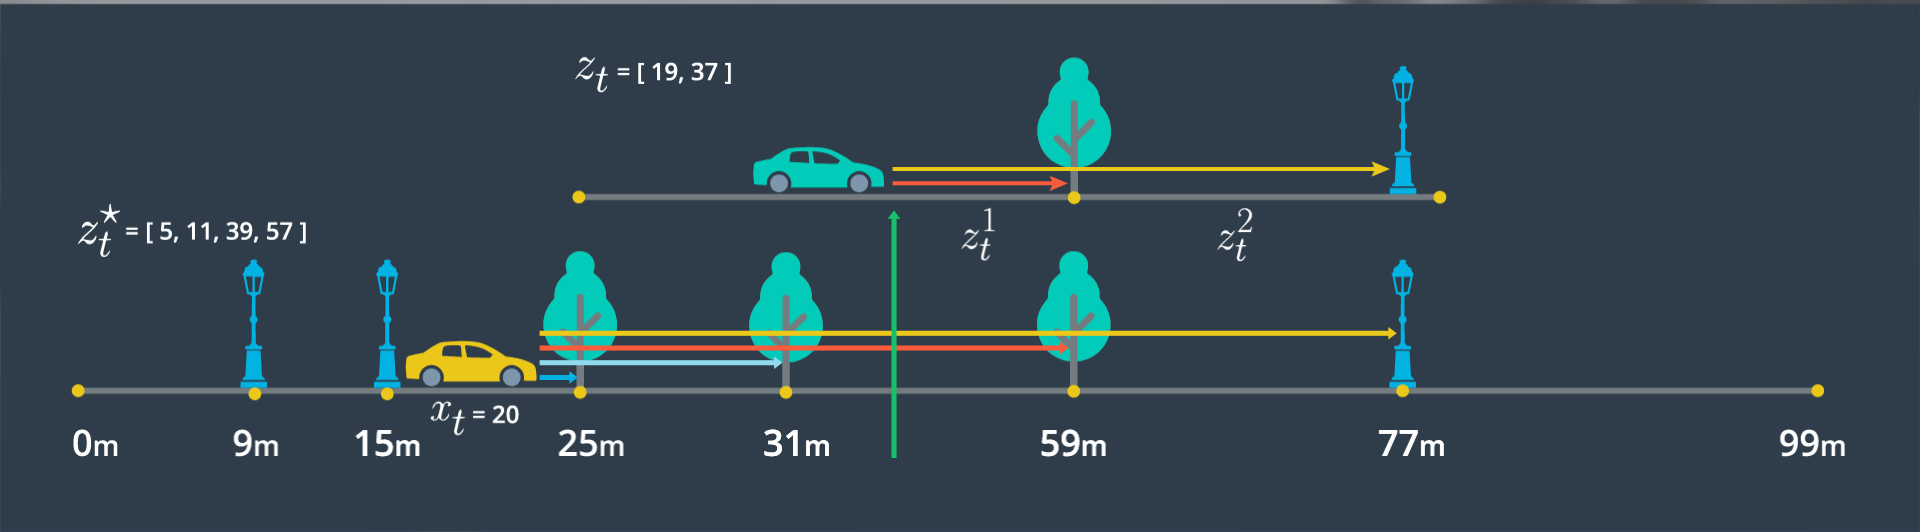
For the figure below, the top 1d map (green car) shows our observation measurements. These are the distances from our actual car position at time t, to landmarks, as detected by sensors. In this example, those distances are 19m and 37m.
The bottom 1d map (yellow car) shows our pseudo range estimates. These are the distances we would expect given the landmarks and assuming a given position x at time t, of 20m. In this example, those distances are 5, 11, 39, and 57m.
The observation model will be implemented by performing the following at each time step:
- Measure the range to landmarks up to 100m from the vehicle, in the driving direction (forward)
- Estimate a pseudo range from each landmark by subtracting pseudo position from the landmark position
- Match each pseudo range estimate to its closest observation measurement
-
For each pseudo range and observation measurement pair, calculate a probability by passing relevant values to norm_pdf:
norm_pdf(observation_measurement, pseudo_range_estimate, observation_stdev) - Return the product of all probabilities
Why do we multiply all the probabilities in the last step? Our final signal (probability) must reflect all pseudo range, observation pairs. This blends our signal. For example, if we have a high probability match (small difference between the pseudo range estimate and the observation measurement) and low probability match (large difference between the pseudo range estimate and the observation measurement), our resultant probability will be somewhere in between, reflecting the overall belief we have in that state.
Let's practice this process using the following information and
norm_pdf
.
- pseudo position: x = 10m
- vector of landmark positions from our map: [6m, 15m, 21m, 40m]
- observation measurements: [5.5m, 11m]
- observation standard deviation: 1.0m
Estimate Pseudo Ranges
QUESTION:
Our first step is to estimate pseudo ranges, please enter the response as a vector with no spaces, in ascending order. For example [5, 4, 7, 20].
SOLUTION:
NOTE: The solutions are expressed in RegEx pattern. Udacity uses these patterns to check the given answer
Association
QUESTION:
Match each observation measurement with the nearest estimated pseudo range. We will only use each measurement and pseudo range once. Enter each pair as a vector of tuples, with no spaces, with tuples ordered as (observation,pseudo_range). For example [(5.5,10),(11,15)]
SOLUTION:
NOTE: The solutions are expressed in RegEx pattern. Udacity uses these patterns to check the given answer
Determine Probabilities
QUESTION:
Calculate a probability for each observation measurement and pseudo range estimate pair by passing relevant data to
norm_pdf
Enter your response as a vector of probabilities in scientific notation with an accuracy of two decimal places, and no spaces. For example [3.14E-15,1.23E-5].
SOLUTION:
NOTE: The solutions are expressed in RegEx pattern. Udacity uses these patterns to check the given answer
Recall that our observation model probability can be determined through
norm_pdf(observation_measurement, pseudo_range_estimate, observation_stdev)
.
Start Quiz:
Observation Model Probability
QUESTION:
To complete our observation model probability, determine the product of each observation probability from the previous quiz. Remember that our observation model probability is the product of the probabilities determined using each (pseudo_range, observation) pair and
norm_pdf
. Enter your response in scientific notation with an accuracy of two decimal places. For example 2.99E-1.
SOLUTION:
NOTE: The solutions are expressed in RegEx pattern. Udacity uses these patterns to check the given answer
Now that we have implemented the observation model manually, we will try out a code implementation in the next few concepts.